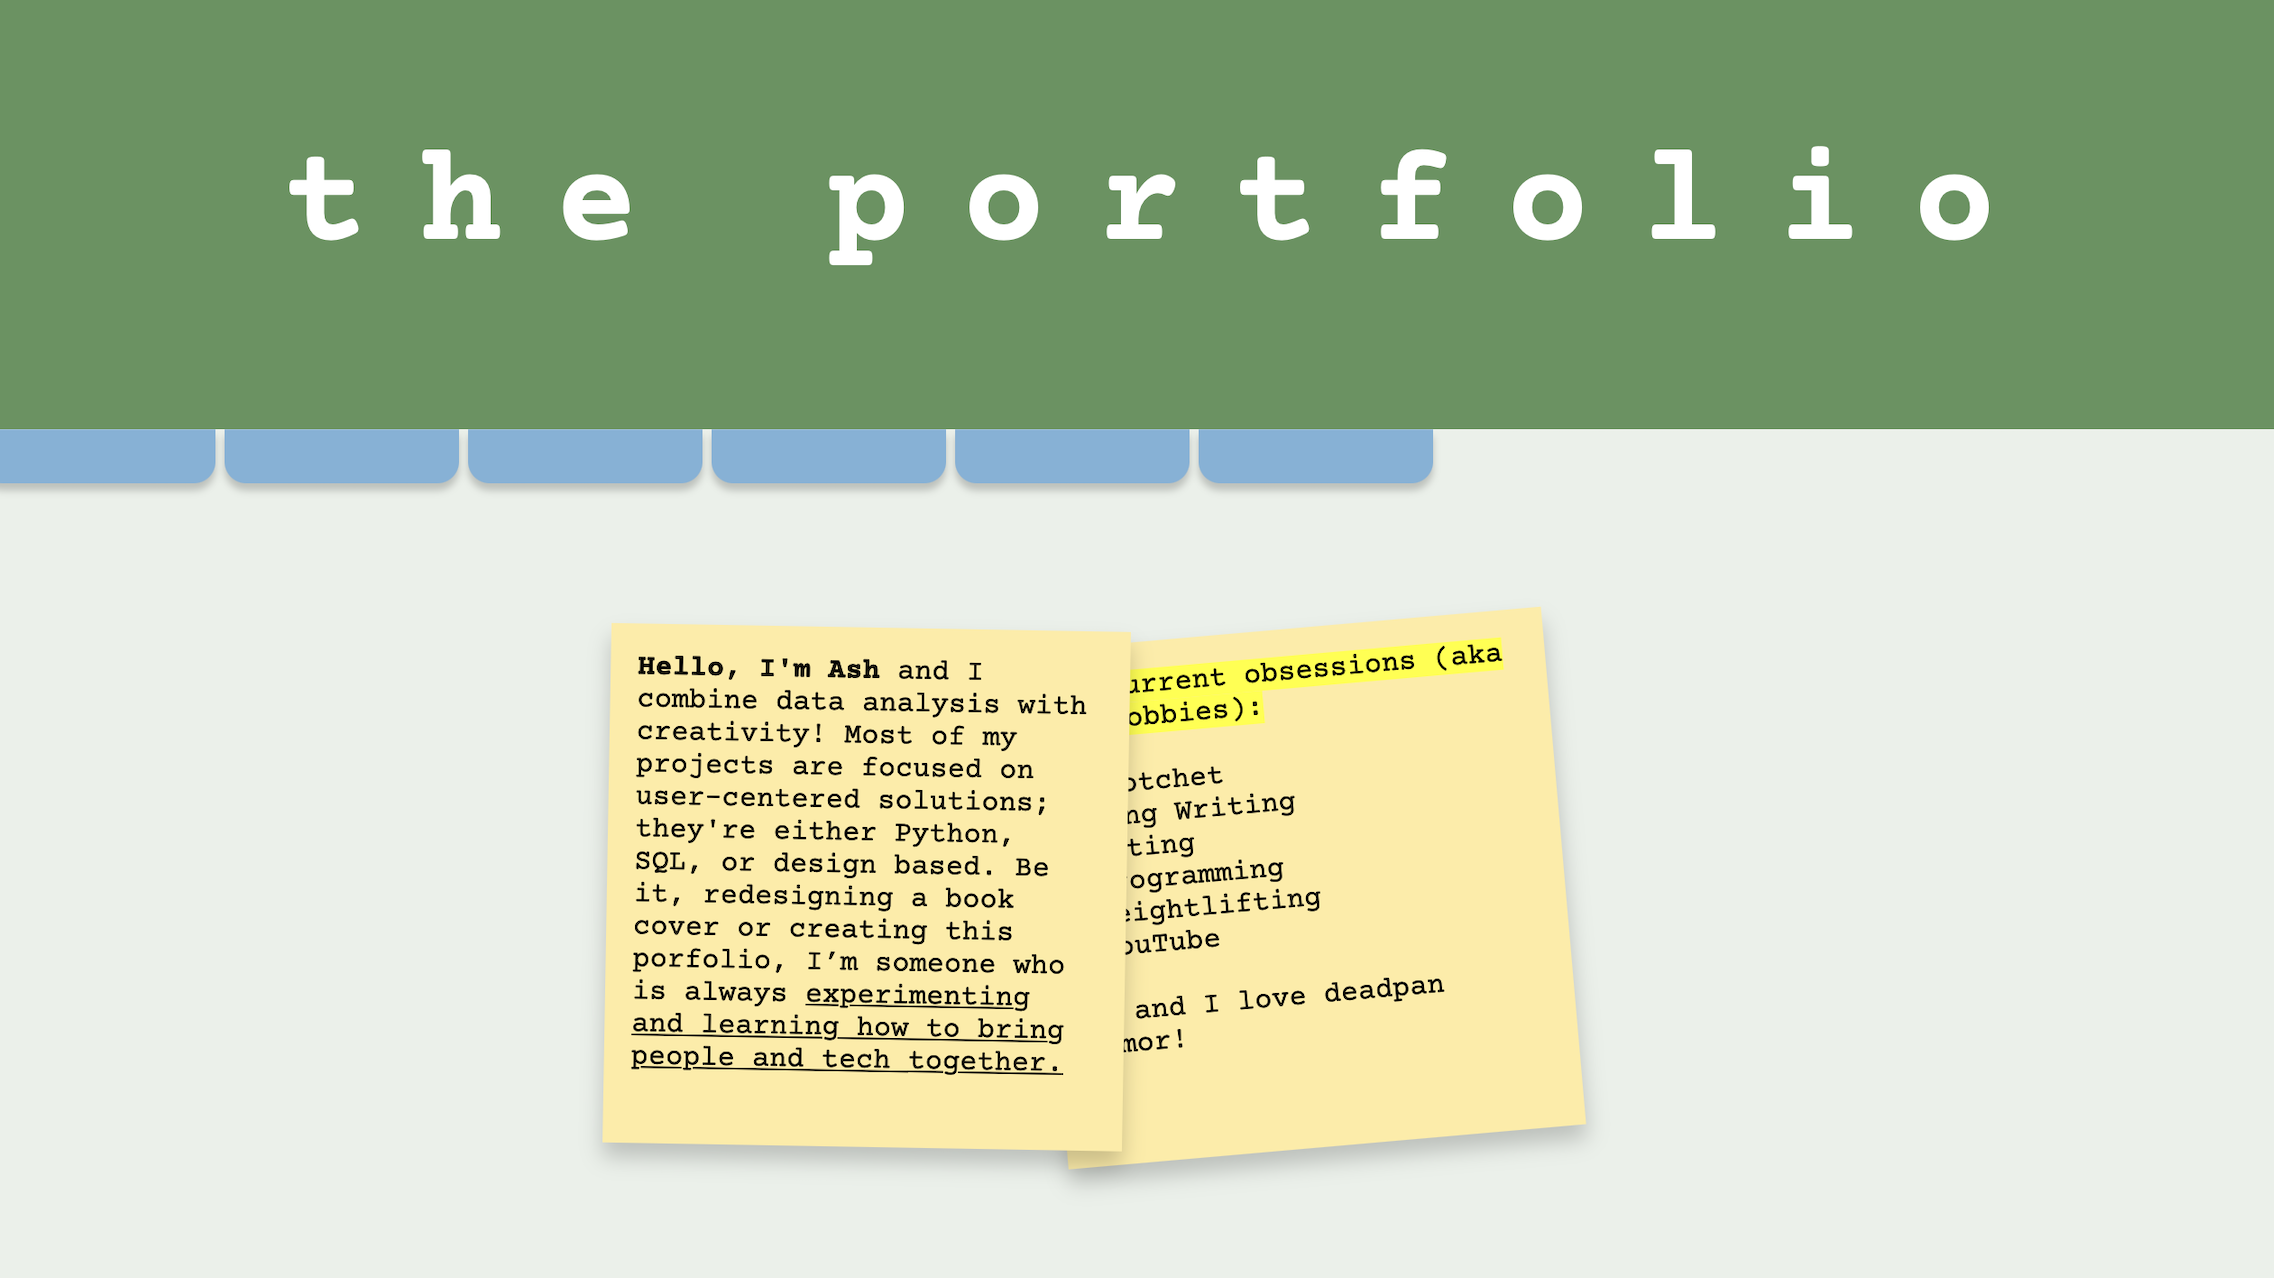
If you clicked the "about me" tab then my sticky-notes must not have satiated your curious wonder. Well...
if you haven't
guessed already, this portfolio is based on the Office (not the UK version, never the UK
version).
Why? Because
I wanted my portfolio to showcase who I am and since the Office built my sense of humor and love for
mockumentaries, I decided it
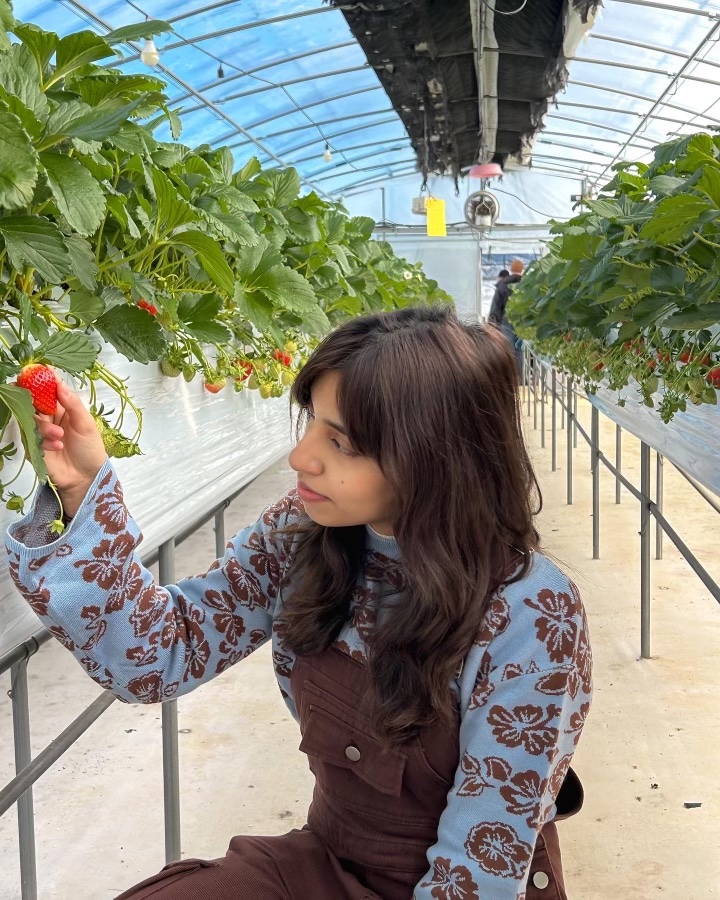
would be the best theme to go with! Also, this photo is my favorite photo of me. I was having a glorious
hair day and wearing my favorite overalls, as I picked my favorite fruit (strawberries 🍓).
Now enough about me. Tell me about yourself... do you like bears, beets, or Battlestar
Galatica?
This analysis explores Netflix’s media catalog and uncovers patterns in genre distribution, release strategies, and content priorities.
This project involves the design and creation of 2-D game assets for a collaborative fungi inspired Unity game.
Recreated my most used apps with Affinity Design: a vector graphics editor and an alternative to Adobe Illustrator.
As social media and influencers begin to climb, I decided to practice creating click-bait inspired thumbnails.
Inspired by the organizations I had joined, I decided to practice marketing by designing an invite.
Decided to turn a regular image into a modernized advertisement. I would like to note that on the next version, I plan on recoloring it to make it pop more.
A more personal project of mine, I decided to create post-cards for the places I traveled to. It's a great way for me to productively reminisce.
I'm a big fan of movie theatres so I decided to create a piece of vector art based off that interest.
Designed a movie poster for one of my most liked coming-of-age movies. It's called DiDi, if you're interested.
I created a Tableau dashboard that analyzed the patterns between population growth and pet ownership in the U.S. You can explore the dashboard by clicking here.
I challenged myself to create my own online portfolio. This was a fun project that challenged me to utilize Figma to design and HTML/CSS/Javascript to create the layout of my website.
This project investigates patterns in Netflix's catalog to understand what factors play a critical role in Netflix's decision to produce or acquire certain movies or tv-shows. The three factors that will be focused on are: release periods, genres, and maturity ratings. By examining these together, we can discover how Netflix's production strategy and audience targeting shape its media library.
#change date to consistent date format
dataset['date_added']=pd.to_datetime(dataset['date_added'], errors='coerce')
dataset['date_added']=dataset['date_added'].dt.strftime('%Y-%m-%d')
#update table with new dates
dataset.to_sql('db_flix',connection,if_exists='replace',index=False)
print("Table updated successfully")
query="""
SELECT
strftime('%Y',date_added) AS year,
type,
listed_in
FROM db_flix
WHERE type LIKE 'tv show'
"""
result=pd.read_sql(query,connection)
#call separate_rows method
result=separate_rows(result,'listed_in')
#count and group by year
year_genre_count = result.value_counts(['year','listed_in']).reset_index(name='total')
#sort the values on x-axis
year_genre_count = year_genre_count.sort_values(by='year',ascending=True)
#use seaborn to create multi-bar graph
plt.figure(figsize=(12,5))
graph_bar=sns.barplot(data=year_genre_count, x='year', y='total', hue='listed_in',palette='tab20')
plt.title('Figure 3.2:\nNetflix Yearly Content Distribution by Genre (TV)')
plt.xlabel('Year')
plt.ylabel('Total')
plt.legend(title='Genres', fontsize=8)
plt.tight_layout()
plt.show()
This EDA uncovered trends that provided a starting point for deeper reasearch into timing, genre patterns, and target audience strategies. Below you will find two possible future endevours to expand on this analysis: